Data year: 2025 | Last checked: October 3, 2026 | Understand Japan | Japanese Best
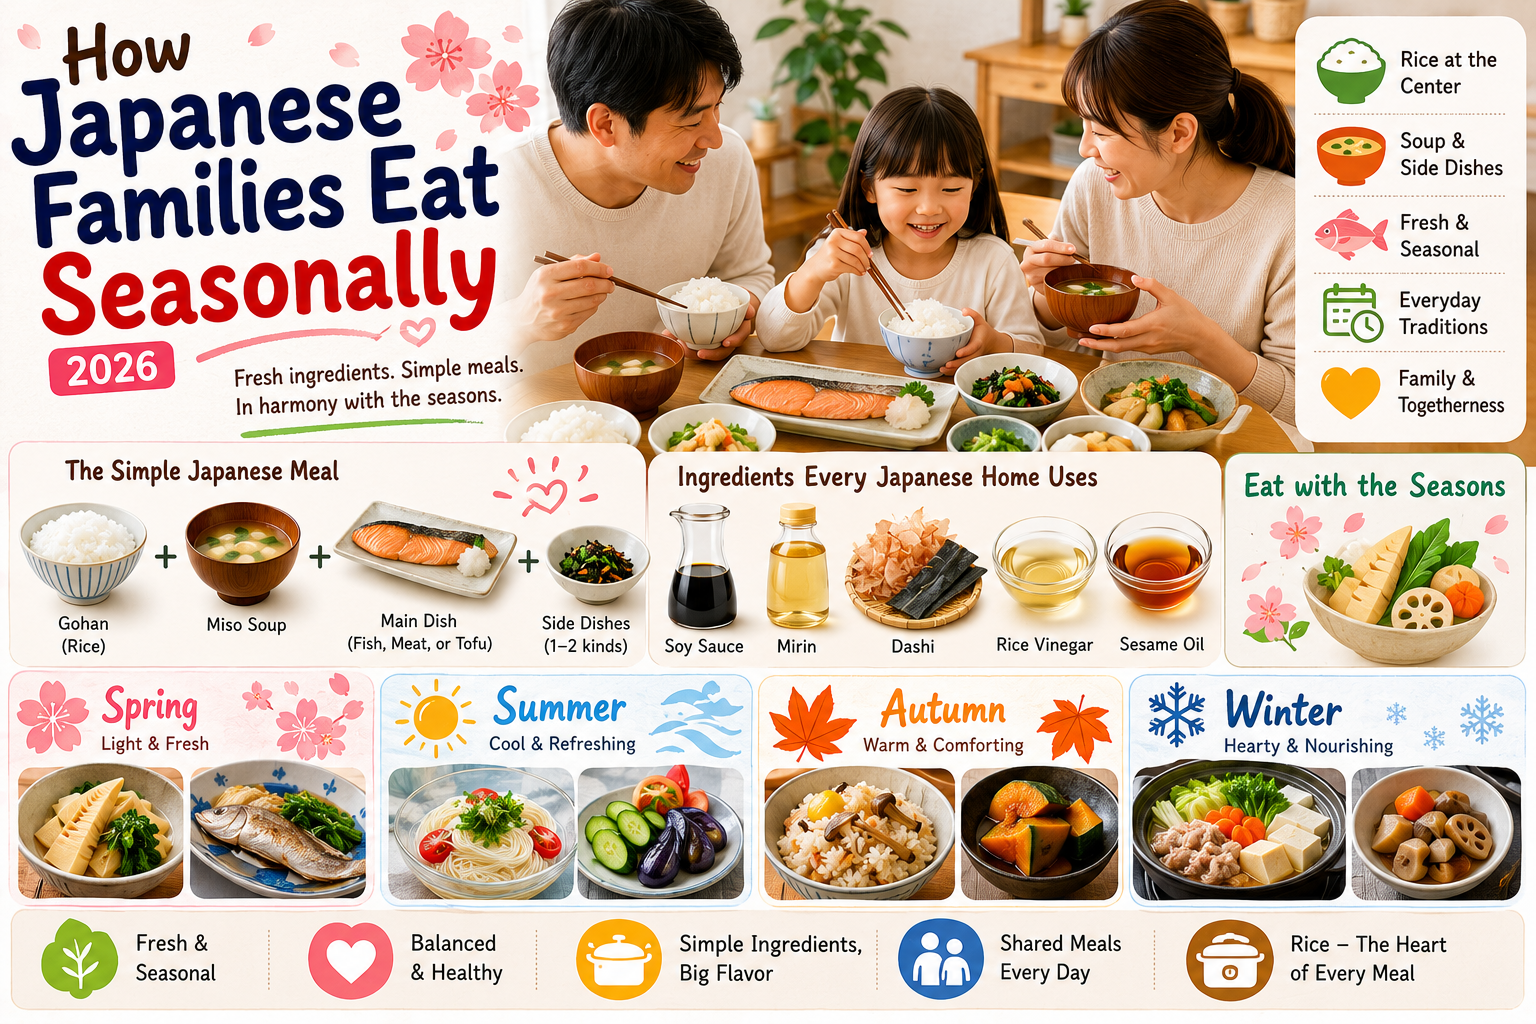
Shun (旬) is the Japanese word for the time of year when a food is in season. Rather than repeat the usual lists, this page measures seasonality. We added up the 2025 monthly arrival figures (kg) from the Tokyo Metropolitan Central Wholesale Market, the city’s main wholesale markets for produce and seafood, and calculated what share of each food’s yearly volume arrived in its busiest three months. A high share means a strongly seasonal food in Tokyo; a low share means it is on sale all year.
- How to read the numbers
- Table 1: Strongly seasonal foods in Tokyo’s markets (2025)
- Table 2: What is in season each month (from Table 1)
- Table 3: Foods that are on sale all year
- Table 4: Year-round does not mean one region. Where Tokyo’s cabbage came from
- What this means if you live in or visit Tokyo
- Correction
- Sources
How to read the numbers
- Source: Tokyo Metropolitan Central Wholesale Market, “Market statistics detail data” (市場統計情報明細データ) for 2025, produce and seafood. These are monthly quantities by item, market and origin, published January 2026.
- Our calculation: we summed all markets and all origins for each item and month. Where the market lists several varieties (for example strawberries or persimmons), we added the varieties named in the tables below.
- What it measures: arrivals at Tokyo’s central wholesale markets, not national production or what households eat. Other regions of Japan have different seasons and supply routes.
Table 1: Strongly seasonal foods in Tokyo’s markets (2025)
| Food | Type | Busiest 3 months | Share of 2025 arrivals in those 3 months |
|---|---|---|---|
| Chestnuts (kuri) | Fruit/nut | Sep–Nov | 99.1% |
| Cherries (sakuranbo) | Fruit | May–Jul | 96.7% |
| Japanese pears (nashi: Kōsui, Hōsui, Akizuki, Niitaka, others) | Fruit | Aug–Oct | 94.4% |
| Bamboo shoots (takenoko) | Vegetable | Mar–May | 94.2% |
| Peaches (5 listed items) | Fruit | Jul–Sep | 91.3% |
| Sweetcorn | Vegetable | Jun–Aug | 90.3% |
| Persimmons (kaki: Tone, Hiratanenashi, Fuyū, Jirō, others) | Fruit | Sep–Nov | 87.8% |
| Pacific saury (sanma) | Seafood | Sep–Nov | 84.0% |
| Chum salmon (shirozake) | Seafood | Aug–Oct | 84.0% |
| Watermelon (incl. small “kodama” type) | Fruit | Jun–Aug | 77.5% |
| Rapeseed greens (nanohana) | Vegetable | Jan–Mar | 77.4% |
| Broad beans (soramame) | Vegetable | Apr–Jun | 77.4% |
| Mandarins (mikan: very early, early, regular, greenhouse) | Fruit | Nov–Jan | 74.2% |
| Edamame | Vegetable | Jun–Aug | 73.9% |
| Strawberries (6 listed varieties) | Fruit | Feb–Apr | 62.4% |
Table 2: What is in season each month (from Table 1)
Each food is listed in the months that make up its busiest three months in 2025.
| Month | Foods in their busiest window |
|---|---|
| January | Rapeseed greens, mandarins |
| February | Rapeseed greens, strawberries |
| March | Bamboo shoots, rapeseed greens, strawberries |
| April | Bamboo shoots, broad beans, strawberries |
| May | Bamboo shoots, broad beans, cherries |
| June | Broad beans, edamame, sweetcorn, cherries, watermelon |
| July | Edamame, sweetcorn, cherries, watermelon, peaches |
| August | Edamame, sweetcorn, watermelon, peaches, Japanese pears, chum salmon |
| September | Peaches, Japanese pears, chestnuts, persimmons, saury, chum salmon |
| October | Japanese pears, chestnuts, persimmons, saury, chum salmon |
| November | Chestnuts, persimmons, mandarins, saury |
| December | Mandarins |
Table 3: Foods that are on sale all year
For these items the busiest month in 2025 was less than three times the quietest month (our calculation: highest monthly kg ÷ lowest monthly kg).
| Food | Busiest ÷ quietest month | 2025 arrivals |
|---|---|---|
| Oysters (in shell) | 1.4× | about 1,958 t |
| Cabbage | 1.5× | about 169,069 t |
| Onions | 1.5× | about 96,347 t |
| Bananas (imported) | 1.7× | about 11,739 t |
| Horse mackerel (aji) | 1.8× | about 9,997 t |
| Sweet potatoes | 2.6× | about 28,228 t |
Some foods with a strong seasonal image were less concentrated in Tokyo’s 2025 figures. Skipjack tuna (katsuo) had 44.2% of its arrivals in its busiest three months (May, July, September), and yellowtail (buri, one size grade) had 48.9% (March, April, October). The season you may read about elsewhere does not always match when a food actually reaches Tokyo’s markets.
Table 4: Year-round does not mean one region. Where Tokyo’s cabbage came from
Cabbage arrives in roughly even volumes all year, but the source moves around the country. Top two origin prefectures by month in 2025 (share of that month’s cabbage arrivals, our calculation):
| Month | Largest origin | Second |
|---|---|---|
| Jan | Aichi 50.6% | Chiba 27.1% |
| Feb | Aichi 52.6% | Chiba 31.0% |
| Mar | Aichi 52.0% | Chiba 24.8% |
| Apr | Kanagawa 45.7% | Aichi 36.6% |
| May | Chiba 37.3% | Kanagawa 24.7% |
| Jun | Chiba 38.0% | Ibaraki 27.3% |
| Jul | Gunma 72.9% | Iwate 13.8% |
| Aug | Gunma 79.8% | Iwate 14.3% |
| Sep | Gunma 79.6% | Iwate 15.1% |
| Oct | Gunma 68.8% | Iwate 12.3% |
| Nov | Chiba 43.0% | Aichi 20.0% |
| Dec | Aichi 41.6% | Chiba 36.7% |
So even a food that is “always available” follows a seasonal relay between growing areas. The prefecture printed on the label at a Tokyo shop changes with the season.
What this means if you live in or visit Tokyo
- For fruit such as cherries, pears, peaches, chestnuts and persimmons, almost all of the year’s supply arrives within three months. Outside those months, expect little or none in markets.
- Staples such as cabbage, onions and bananas are available all year, so they do not tell you much about the season.
- These figures cover Tokyo’s central wholesale markets in 2025. Seasons in Hokkaidō or Okinawa, and in other years, may differ.
Correction
An earlier version of this page described “cabbage and new potatoes (shin-tamanegi, new onions)”. Shin-tamanegi means new onions, not potatoes. The page has since been rebuilt around market data.
Sources
- Tokyo Metropolitan Central Wholesale Market — Market statistics (monthly/annual reports): 2025 produce detail data (xlsx) and 2025 seafood detail data (xlsx)
Related: Tax-free shopping at Don Quijote: what changes on November 1, 2026
Comments